The two terms "weather" and "climate" are nowadays often confused or used as synonyms. Although both words refer to processes or changes within the atmosphere, a strict separation is nevertheless essential – this is especially true in the course of the increased discussions around global warming.

Weather – our daily company
The word"weather" is derived from the Old High German wetar, which stands for "wind" or "blowing". It describes the short-term state of the atmosphere, such as sunshine, cloud cover, rain or even heat and cold. So it corresponds exactly to what we see every day on television, read on the weather page in the newspaper, or hear on the radio. Weather is therefore our daily companion. These forecasts are made by meteorologists using complex weather models.

Fig. 1: Example of a weather forecast for the coming days; Source: MeteoNews
Climate – the average weather
As mentioned in the introduction, "climate" also includes processes in the atmosphere. However, compared to weather, it is not individual events, such as an exceptionally hot or rainy day, that are important here, but rather the average weather over a longer period of time that is of interest. Specifically, weather is typically averaged over a 30-year period. We often hear or read a summary at the end of a month or season, often including the phrases "too warm," "wetter than average," or "more sunshine than usual." The past month or season is thus compared to the long-term average and classified. The currently frequently used climate norm describes the average of the years 1991-2020; 1961-1990 is not infrequently chosen as the reference period.
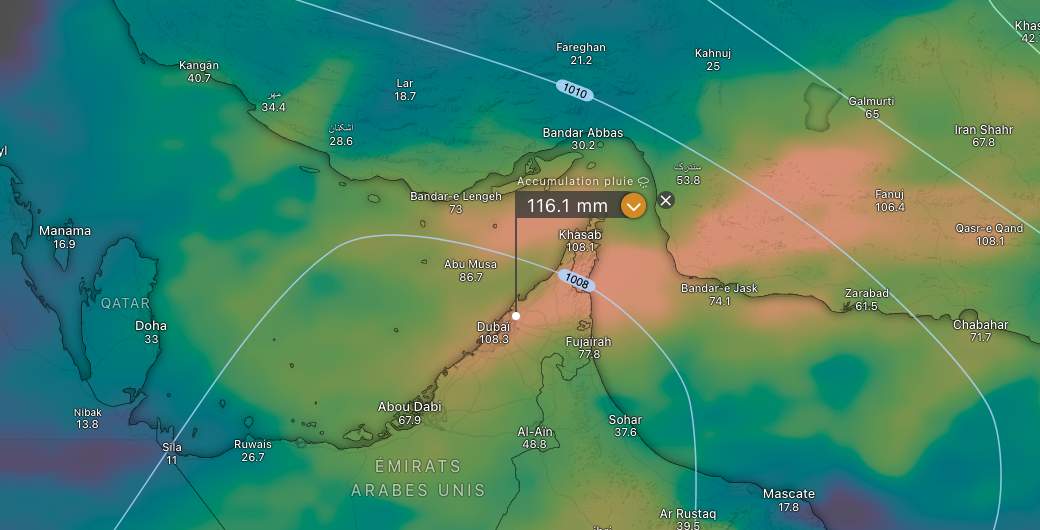
")
Fig. 2: Exemplary the precipitation deviation of the current month compared to the norm (1991-2020); Source: MeteoNews, UBIMET
Weather or climate?
After the partly very hot days with up to 35 degrees, the current maximum values between 25 and 27 degrees seem almost "unworthy of summer". Also the look ahead promises until the end of the month and with a possible exception on Sunday for the German-speaking part of Switzerland probably no more hot days, partly the temperatures during the day may even fall just short of the summer mark of 25 degrees. In certain circles, this is an indication that climate change does not exist. In the short term, one can already say that such maximum values for the last decade of July are in part rather below average. But it is precisely these fluctuations between too warm and too cool that characterize the weather and make it exciting (at least for us). Individual days or even weeks have no decisive influence on the climate. Only when a trend emerges over years and decades can we therefore speak of a climate change.
By the way, the climate norm foresees an average maximum temperature of 25.2 degrees for July, so we will be above that in many cases next week as well.
Weather extremes and climate change
After extreme events, such as a particularly strong thunderstorm or long dry spells, the question often arises as to what extent climate change favored such an event. Broken down to individual events, it is difficult to say whether or not a particular dry spell would have occurred to the same extent without man-made climate change. However, it is possible to calculate how likely such an event would have been under the earlier climate and how likely it is today with human influence on the climate. However, this is a complex undertaking and is also known as"climate attribution", a more detailed explanation of this topic is beyond the scope of this blog.
That the climate has warmed in recent decades and will continue to warm is undisputed. This can be clearly seen, for example, in the graph below. The upper graph shows the deviation of the average annual temperature compared to the reference period. A warming trend can clearly be seen, but there are still individual years that deviate from the general trend. However, this is of minor importance for the climate analysis. The picture is somewhat more differentiated for precipitation, where no clear climatological trend can be observed.
 and precipitation curve (bottom)")
Fig. 3: Temperature curve (top) and precipitation curve (bottom); Source: Meteostats
disclaimer
The content of this article has been at least partially computer translated from another language. Therefore, grammatical errors or inaccuracies are possible. Please note that the original language version of the article should be considered authoritative.